SDK
Dashboard
A visual command center for developers integrating garden sdk
User Research
Product Design
Market analysis & Research

Overview
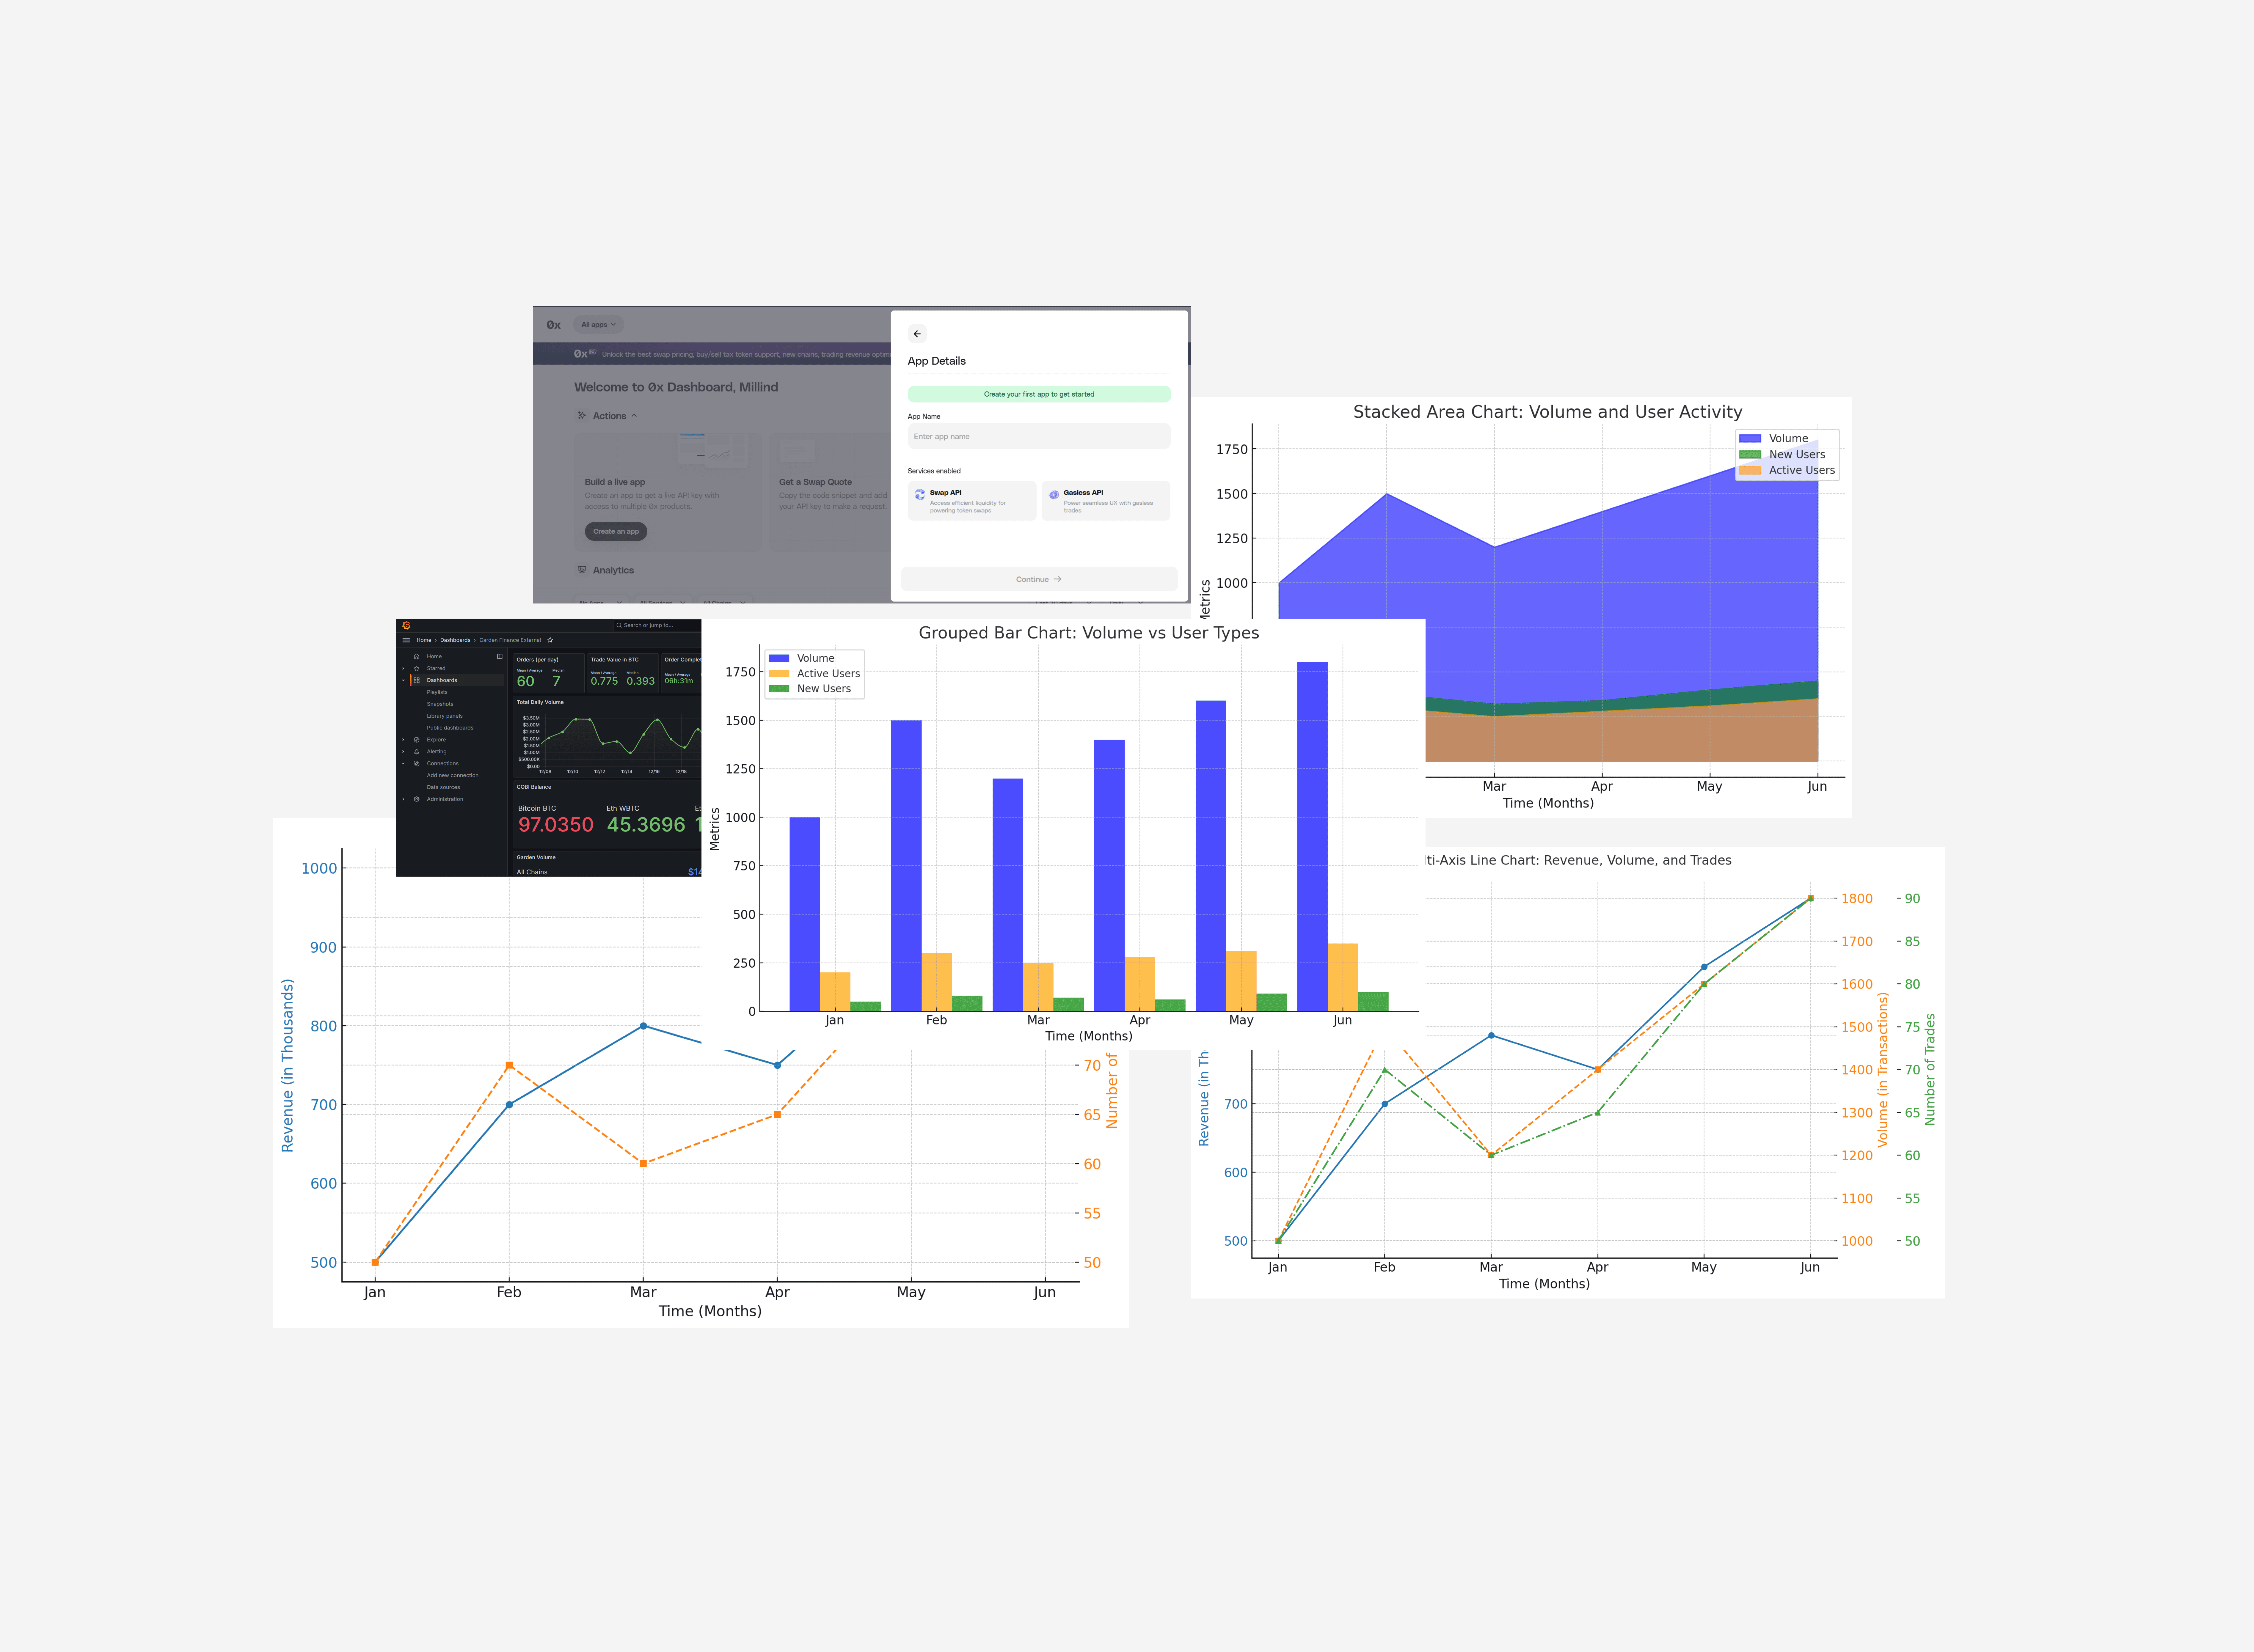
The Garden SDK Dashboard is a visual command center created for developers integrating Bitcoin into their dApps using the Garden SDK. It turns complex backend systems like order lifecycles, relay operations, and HTLC-based swaps into a clear, transparent, and testable interface.
Insights
SDKs often operate in the background, powerful but invisible. Developers rely on terminal outputs and raw logs, which makes understanding system behavior difficult.
The idea was to bring that layer forward, giving developers a way to see what is happening without overloading them with noise.
Key Observations:
Developers needed a visual structure that aligns with real API events and state transitions.
Order and relay flows were difficult to interpret without clear visual mapping.
Clarity and consistency mattered more than visual flair.
Concept
The concept focused on clarity, control, and transparency.
The dashboard bridges system data and developer context, allowing users to trace every step of a swap or relay through clear visual feedback.
Approach:
Created a modular layout with sections for Overview, Quotes, Orders, Sessions, Relays, and Docs.
Used structured data visuals to represent live network activity and swap status.
Kept the Garden identity consistent with calm gradients, balanced typography, and a neutral palette.
Process
1. Define scope
Mapped all SDK data flows from order creation to relay execution to understand what needed visualization.
2. Build hierarchy
Structured the dashboard into clear modules that connect high-level insights with granular transaction data.
3. Design state logic
Created color and motion cues that make system behavior instantly recognizable.
4. Refine visuals
Used a clean, light interface with generous whitespace and balanced contrast for readability and scale.
5. Validate with data
Worked closely with engineers to ensure every visual reflected real-time API responses and accurate data.
Impact
The SDK Dashboard became the single source of truth for developers working with Garden.
Designing the SDK Dashboard was about transforming backend systems into something human and observable.
SDK
Dashboard
Garden Finance is a next-generation liquidity routing protocol built to simplify intent-based swaps through atomic execution.
Product Design
User Research
Market analysis & Research
Overview
The Garden SDK Dashboard is a visual command center created for developers integrating Bitcoin into their dApps using the Garden SDK. It turns complex backend systems like order lifecycles, relay operations, and HTLC-based swaps into a clear, transparent, and testable interface.
Insights
SDKs often operate in the background, powerful but invisible. Developers rely on terminal outputs and raw logs, which makes understanding system behavior difficult.
The idea was to bring that layer forward, giving developers a way to see what is happening without overloading them with noise.
Key Observations:
Developers needed a visual structure that aligns with real API events and state transitions.
Order and relay flows were difficult to interpret without clear visual mapping.
Clarity and consistency mattered more than visual flair.
Concept
The concept focused on clarity, control, and transparency.
The dashboard bridges system data and developer context, allowing users to trace every step of a swap or relay through clear visual feedback.
Approach:
Created a modular layout with sections for Overview, Quotes, Orders, Sessions, Relays, and Docs.
Used structured data visuals to represent live network activity and swap status.
Kept the Garden identity consistent with calm gradients, balanced typography, and a neutral palette.
Process
1. Define scope
Mapped all SDK data flows from order creation to relay execution to understand what needed visualization.
2. Build hierarchy
Structured the dashboard into clear modules that connect high-level insights with granular transaction data.
3. Design state logic
Created color and motion cues that make system behavior instantly recognizable.
4. Refine visuals
Used a clean, light interface with generous whitespace and balanced contrast for readability and scale.
5.Validate with data
Worked closely with engineers to ensure every visual reflected real-time API responses and accurate data.
Impact
The SDK Dashboard became the single source of truth for developers working with Garden.
Designing the SDK Dashboard was about transforming backend systems into something human and observable.

You bring the vision. I bring the craft. We build it right, together.
2025©All rights reserved.
Phone
You bring the vision. I bring the craft. We build it right, together.
2025©All rights reserved.
Phone
You bring the vision. I bring the craft. We build it right, together.
2025©All rights reserved.
Phone